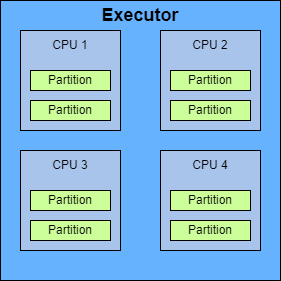
A wide variety of issues are caused by incorrect partitioning in Spark, from slow performance to fatal memory errors. In the best case, the data are a nice, mostly static size and determining the partitions is a relatively simple calculation based off of the size of the data, and the resources available to the job with the goal of getting the ideal 2-3 tasks per CPU core [1].
However, the real world is not ideal, and data size often varies wildly from one run to another. This means that Spark scripts will often have some logic built into them to calculate the number of partitions based on information available at runtime.
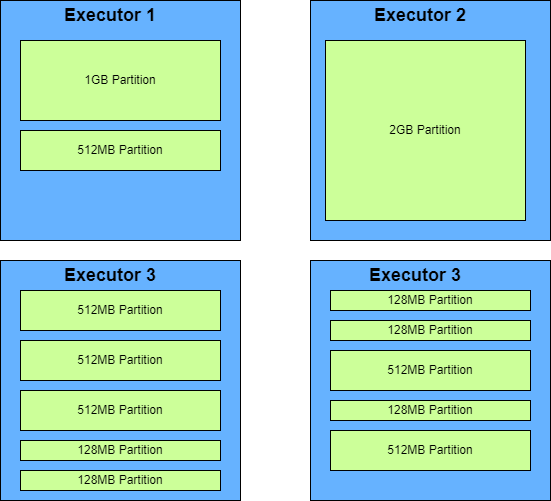
In my experience, using some basic maths and the row count is the common method of handling partitioning in a job that processes input data that varies greatly in size. There are definite merits to this approach as it generates a partition count with a relatively even spread of the rows across each partition, and it definitely can work depending on the use case. However, since the size of a row can also vary, using this method can still very easily lead to incorrect partitioning, along with all the associated issues.
The aim of this post is to showcase a method that I sometimes use to get the size of the data at runtime rather than relying on row counts. In favour of keeping this article focused and brief, I won’t go into the other complexities around partitioning such as managing the associated Spark configurations. There are plenty of other resources available online that cover those in much more detail than I can in a short post like this.
Now I’m sure some of you are scratching your heads wondering how on Earth you can get an accurate measure for the size of the data during the runtime of a distributed application. Well, it is a bit of a hacky solution, but thanks to some of Sparks built-in methods, it’s not impossible.
Some of the more experienced Spark users among you will know of PySpark’s DataFrame.explain() function [2]. For those that don’t, a brief explanation is that it generates the Spark execution plan, which can be used as part of tuning and otherwise auditing the performance of a Spark job.
What you may not know is that with some manipulation of the output for SparkSQL equivalent explain cost select * from data, you can get the size of the data as calculated by Spark’s plan.

Although the plan output is somewhat annoying to handle with its inconsistent use of units, some testing and tweaking will yield a short function capable of determining the size of a data frame during runtime, which allows for a much more accurate partitioning strategy than relying on row counts.

I trust that I have provided some insight into a useful method of dynamically calculating the size of a Spark data frame at runtime and the benefits this offers when optimising the partitioning strategy of a Spark script.
References
[1] https://spark.apache.org/docs/latest/tuning.html#level-of-parallelism [2] https://spark.apache.org/docs/latest/api/python/reference/api/pyspark.sql.DataFrame.explain.html